Query Kibana (includes useful queries)
All logs for GOV.UK on all environments are collected in Kibana, which you can access through Logit.
Kibana can be searched using DQL syntax, Lucene search syntax or full JSON-based Elasticsearch queries. See an example Elasticsearch query below.
Set up the UI
The default view for Kibana includes a timestamp and a grouped _source column of all information per log. Depending on what you’re trying to achieve, you may find it beneficial to re-organise your view.
You can specify a field in the logs list by navigating the “Available Fields” list on the left hand side, hovering over a field you want to interrogate and clicking “add”. Some useful fields include:
- application
- controller
- route
- path
- status
- request
- tags
You can additionally remove fields by following the same steps above for “Selected Fields” and clicking “remove”.
You can also manage the timeline bar chart at the top of the view by changing the dropdown above the bar chart from “auto” to whichever delimitater suits your needs (hourly, daily, weekly etc) and specify the time frame of the bar chart by clicking the time range in the top right-hand corner.
You can change which indices you are searching, in the top left of the Kibana interface there is a dropdown which will default to filebeat-*. If you wish to query the kubernetes events you need to change this to kubernetes-events-*.
Examples
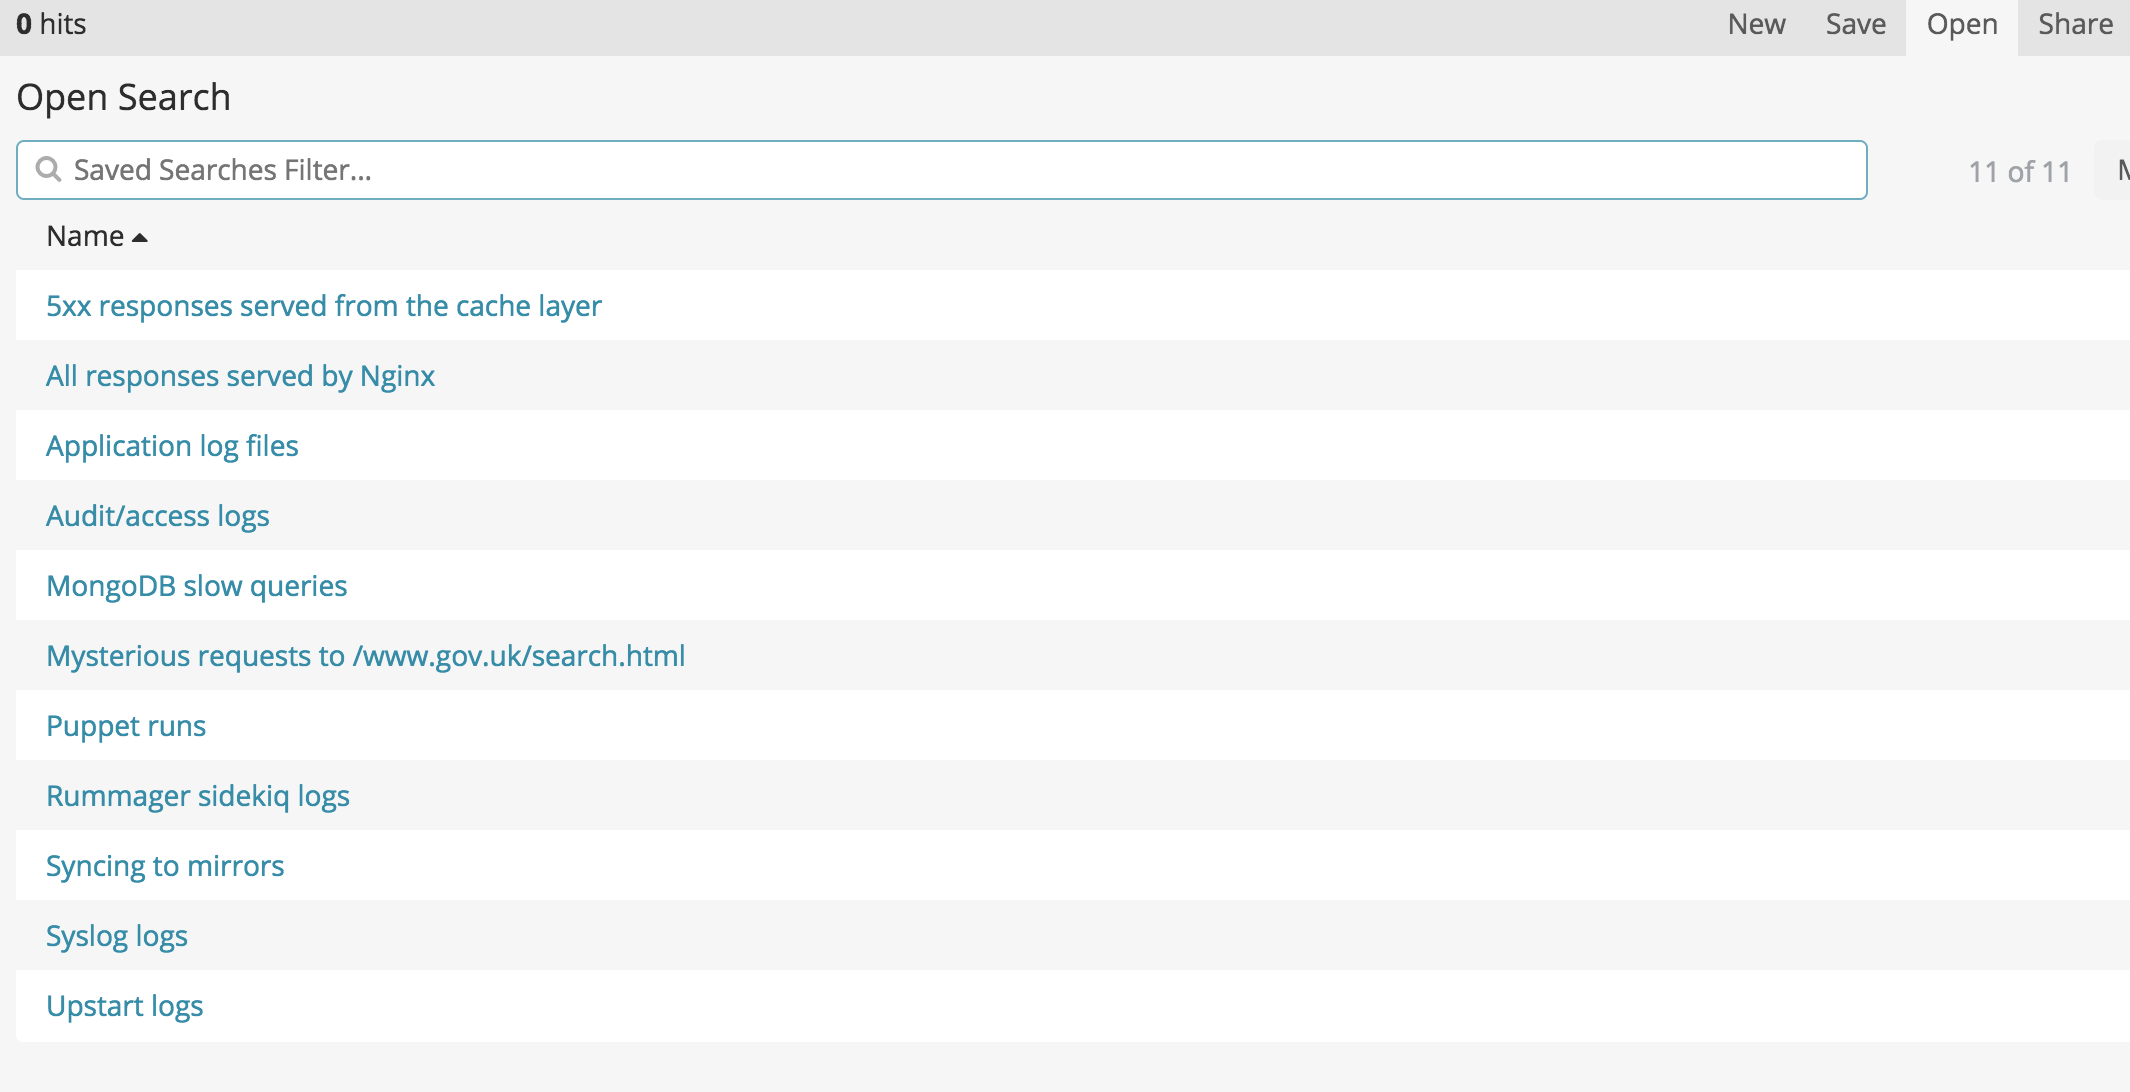
You can save and load queries using the buttons in the top right. You may want to use one of the existing queries as a starting point instead of writing a query from scratch.
Every change to the query changes the URL in the browser. This URL is rather long and unfriendly, and often gets mangled by the Slack or Trello parser when trying to share it. Instead, you can generate a “short URL” by clicking the “Share” link in the top right, followed by “Short URL”.
All requests rendered by the content_items controller in frontend
application: frontend AND tags: request AND controller: content_items
All requests within the /government/groups path
tags: request AND path: \/government\/groups\/*
5xx errors returned from cache layer
host:cache* AND (@fields.status:[500 TO 504] OR status:[500 TO 504])
Nginx logs
tags:"nginx"
Nginx logs for frontend:
tags:"nginx" AND application:frontend*
Note
The
@timestampfield records the request END time. To calculate request start time subtractrequest_time.
Application production.log files
tags:"application"

tags:"application" AND application:"smartanswers"
MongoDB slow queries
application:"mongodb" AND message:"command"
Mirrorer logs
syslog_program:"govuk_sync_mirror"
Publishing API timeouts
message:"TimedOutException" AND (application:"specialist-publisher" OR application:"whitehall" OR application:"content-tagger")
Kubernetes events
Change the index pattern in the top left to kubernetes-events-* (it will default to filebeat-*), then you can execute the following queries.
In all cases the “message” field will give you a human readable description of the event.
Publisher kubernetes events
involvedObject.name: "publisher"
Search for pods in a backoff restart
reason: "BackOff"
Search for pods which fail to be started
reason: "Failed"
Search for all events about deployment of a specific appear
involvedObject.kind: "Deployment" AND involvedObject.name: "frontend"
Example Elasticsearch query
You can use Elasticsearch queries by clicking “Add a filter” and then specifying “Edit Query DSL”. Here is an example of finding all requests to the Transition Checker login page (ignoring URL query parameters) which resulted in a 410:
{
  "query": {
    "bool": {
      "filter": [
        {
          "term": {
            "status": 410
          }
        },
        {
          "regexp": {
            "request": {
              "value": ".+transition-check/login.+"
            }
          }
        }
      ]
    }
  }
}
This has no advantage over using Lucene query syntax in the search bar, which is much simpler: request:*transition-check\/login* AND status:410.
However, if you wanted to count the number of unique IP addresses that were served this response, you need an aggregation, which requires the Elasticsearch syntax.
Choose “Dev Tools” in the menu on the left, then fill out your JSON search, ensuring that you retain the GET _search on line 1.
You’ll probably want to specify your date range in JSON as there is no way to do this through the UI on this screen.
GET _search
{
  "query": {
    "bool": {
      "filter": [
        {
          "term": {
            "status": 410
          }
        },
        {
          "range": {
            "@timestamp": {
              "time_zone": "+01:00",
              "gte": "2021-06-16T12:00:00",
              "lt": "2021-06-16T17:00:00"
            }
          }
        },
        {
          "regexp": {
            "request": {
              "value": ".+transition-check/login.+"
            }
          }
        }
      ]
    }
  },
  "aggs": {
    "unique-ips": {
      "terms": {
        "field": "remote_addr"
      }
    }
  }
}
Press the “Play” icon to run the query, whose results will appear in the panel on the right.
You’ll see a hits array for each matching record, and also an aggregations object where your aggregations are grouped into buckets.
From here it should be quite simple to count the number of unique IPs.
Gotchas
- Score: does a aggregation of field on last 2000 results
- Terms is not an aggregation of field, it is an aggregation of terms in the field across 1 recent indices
- For more elaborate searching, read about the Lucene and Elasticsearch syntax
@timestampof nginx log entries records request end time is sometimes confusing