Screens that we have in the office
Technical 2nd Line screens
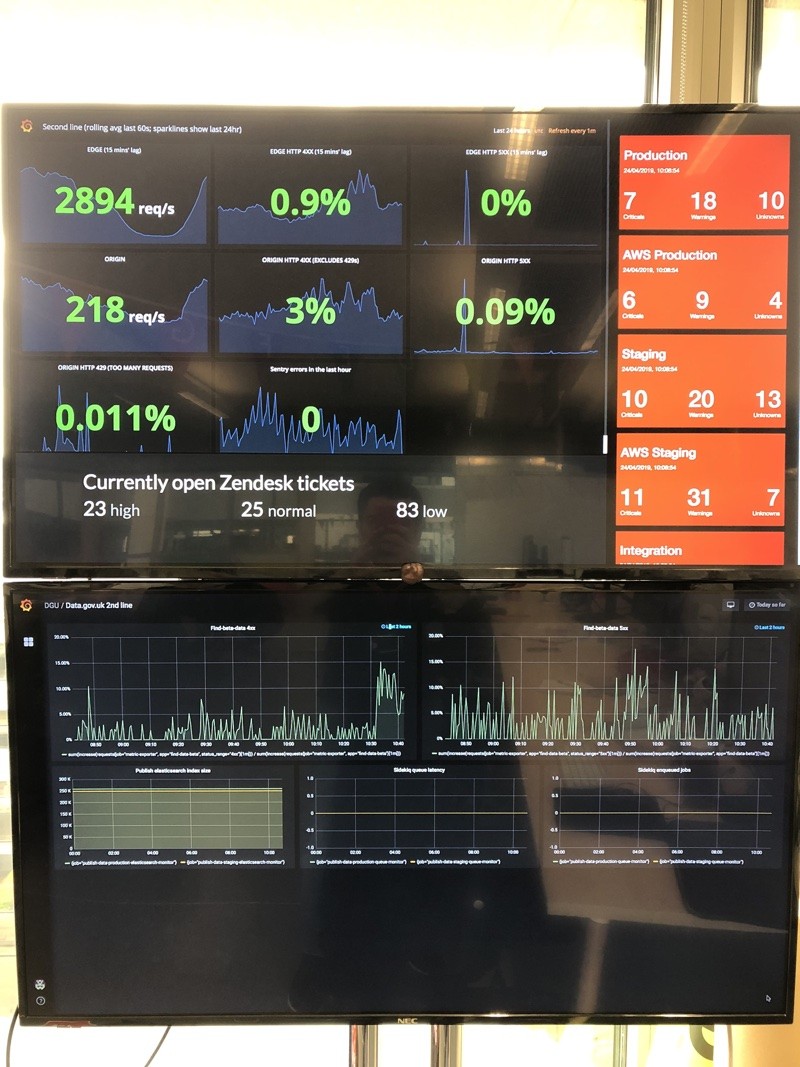
There are two screens by the Technical 2nd Line desks.
The top screen is a webpage running frame splits with three splits: production health, open Zendesk tickets and Icinga alert summary per environment.
The bottom screen is a PaaS-hosted Grafana dashboard showing statistics for data.gov.uk.
Production health
This dashboard contains graphs of edge and origin requests, edge and origin 4xx and 5xx errors, origin 429 (too many requests) errors and Sentry errors. It’s worth keeping an eye on this and looking for any anomalies, as this may indicate issues on production. It’s likely due to our caching behaviour that the top graph of origin errors will indicate issues before they are visible in the second graph, and to end users.
Troubleshooting
Sometimes the ‘EDGE’ graphs may disappear. These are obtained by the
collectd-cdn plugin on
monitoring-1.management.production. If the graphs disappear, they
should write errors to /var/log/syslog. They may look something like
this:
Nov 10 11:37:17 monitoring-1.management collectd[32764]: cdn_fastly plugin: Failed to query service: govuk

Nov 10 11:37:17 monitoring-1.management collectd[32764]: cdn_fastly plugin: Failed to query service: tldredirect

Nov 10 11:37:17 monitoring-1.management collectd[32764]: cdn_fastly plugin: Failed to query service: assets

Nov 10 11:37:17 monitoring-1.management collectd[32764]: cdn_fastly plugin: Failed to query service: redirector
If this happens, restarting collectd on the monitoring server may kick
things into life.
sudo service collectd restart
Open Zendesk tickets
This screen shows a summary of currently open Zendesk tickets in the “2nd line - alerts and issues” queue. It automatically refreshes once a minute.
This is powered by govuk-zendesk-display-screen which is deployed to Heroku.
The username and password can be obtained by logging in to Heroku and viewing the app’s environment variables.
Icinga alert summary per environment
This screen shows a summary of the critical and warning alerts for our environments (production, staging, integration, CI) in colour-coded boxes (red for critical errors, yellow for warnings, purple for unknown errors and green for no issues). It automatically refreshes once a minute.
This is powered by govuk-secondline-blinken which is deployed to Heroku. You must be in the office or on the VPN to access the Icinga instances it gets its data from.