content-data-api: data-warehouse-schema
Table of Contents
- Data warehouse schema
In order to get a better understanding of the problem that the data warehouse aims to solve, it is recommended to first read what is a data wareouse and why GOV.UK uses one
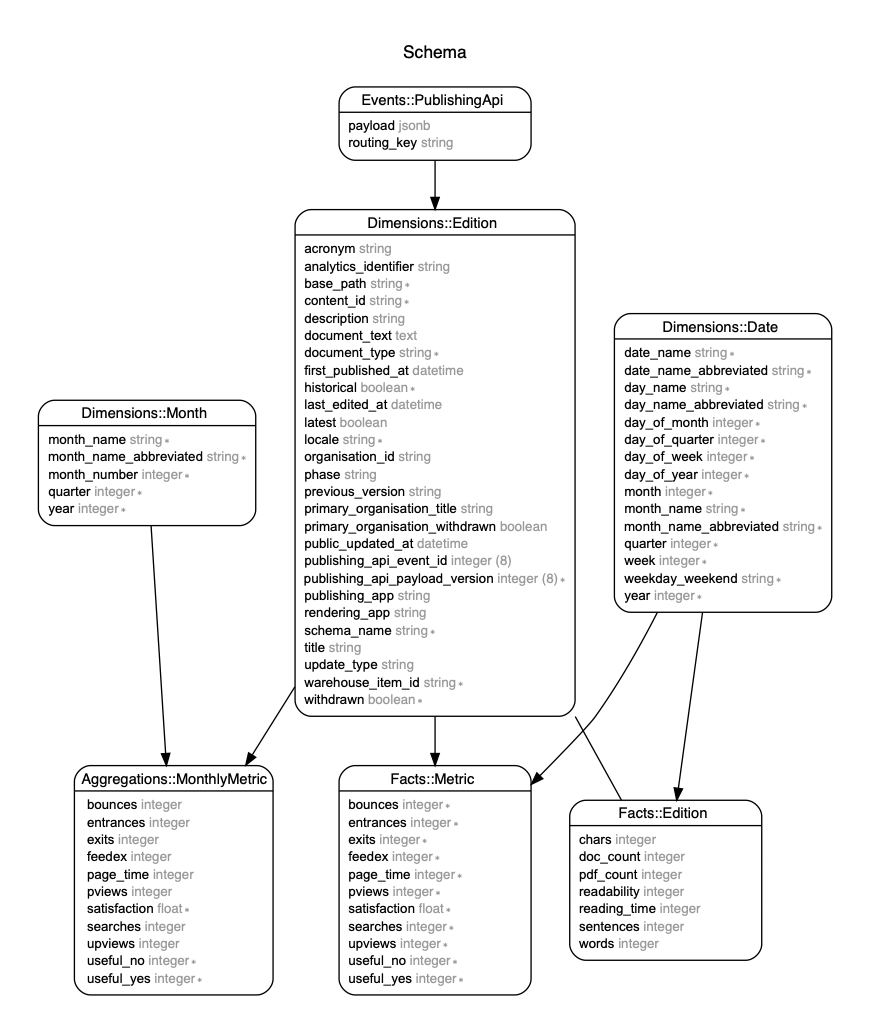
ERD - schema
The image below represents the schema for the data warehouse (start schema). There are not many tables but some of them contains a big number of rows. It is imporant to understand their associations and the type of data that each table stores.
How to generate the schema
The schema is generated using [Rails ERD][rails-erd] running the following command:
$ bundle exec erd --filetype=png --connected --title 'Schema' --filename docs/images/schema
Developer note: The schema might not be an exact representation of the latest version of the schema, but it should be close enough to get an understanding of it.
Introduction
Data warehouses use a different design from standard operational databases (OLTP). The latter are optimized to maintain strict accuracy of data by updating real-time information. Data warehouses, by contrast, are designed to give a long-range view of data over time. They trade off transaction volume and instead specialize in data aggregation.
The data warehouse for GOV.UK:
- Stores data collected from other sources (Feedex, Google Analytics, ...)
- Uses a start schema database design to organise data.
The star schema consists of one or more fact tables referencing any number of
dimension tables; it separates data into `facts` and `dimensions`:
Facts tables
A fact table is the central table in a star schema of a data warehouse. A fact table stores quantitative information for analysis and is often denormalized.
Record meassurements or metrics for specific events. They usually consist of
numeric values and foreign keys to dimensional data.
A fact table consists of two types of columns (foreign keys and meassures).
The foreign keys column allows joins with dimension tables, and the measures columns contain the data that is being analyzed.
In the data warehouse facts tables store metrics about content. These metrics are collected on a daily basis or with each content change.
Dimensional tables
Define facts characteristics, and usually have a relatively small number of records, compared with the facts tables, but higher number of attributes (columns) for filtering and grouping.
Categorizes facts and measures to enable users to answer business questions.
Star Schema for Data Warehouse
Intro
At a high level, we have the following technical requirements:
- Store performance metrics on a daily basis for each GOV.UK content item.
- Store content quality metrics each time a content item is updated or created.
- Store the exact version of the content item that is linked to a metric.
Questions to answer with the schema
The database schema should provide efficient ways to answer the following questions:
- List all the content items from HMRC that had no visits for the last 3 months.
- Which organisations have the lowest satisfaction score?
- Which guides take the most time to read?.
- What formats have a high number of PDFs attachments?
- List all the editions for a content item and the number of unique visits.
- What is the relationship between user satisfaction and reading time? long documents.
Patterns of all questions
All the questions or requests listed abover follow a similar pattern:
- Filter content items by content characteristics.
- Select metrics that are interesting.
- Apply a filter to the metrics.
- Decide grouping criteria.
- Select time range.
Design: Fact tables
Based on the patterns listed above, we have decided to use two facts tables: one
to track performance metrics (facts_metrics) and another one to track content
quality metrics (facts_editions). The reason for breaking the metrics in two
tables is that they are updated with different frequency. Performance metrics are updated daily, whereas quality metrics are only updated as new editions are published.
Daily metrics: table facts_metrics
Stores performance metrics for each content item in GOV.UK. It is updated daily.
These are some of the metrics that we currently store:
| metric name | source |
|---|---|
| feedex | Number of comments in Feedex |
| pviews | Number of page views |
| upviews | Numnber of unique page views |
| useful_yes | Number of positive reponses in user survey |
| searches | Number of internal searches |
For each content item that is live in GOV.UK, on a daily basis, we create a
row in the facts_metrics table containing performance metrics that are
collected from external systems like Feedex or Google
Analytics.
Facts Editions: table facts_editions
Stores content metrics for each version of a content item. It is updated each
time a content item is modified or created.
| metric name | source |
|---|---|
| pdf_count | Number of pdf attachments |
| word_count | Number of word attachments |
| reading_time | Reading time for page content |
| words | Number of words |
For each update or creation of a content item we have a new entry in the
facts_edition table so we track the exact version of the content item attached
to the metrics.
Dimensions
Dimensions provide contextual information to Facts tables. They are usually
referenced from the facts tables via a foreign key: many-to-one association.
Editions dimension
Contains the attributes of the content item and it is updated each time a new
edition is published.
Each time a content item is updated or edited (via publishing-api), a new edition is created in the data warehouse. This way we can track changes to content within the data warehouse and metrics associated with each edition the metrics.
Important attributes of the dimension editions table are:
| metric name | source |
|---|---|
| base_path | The base path for the edition |
| content_identifier | The content id for the edition |
| warehouse_item_id | Uniq identifier (see ADR) |
| title | The title for the edition |
It is important to understand the grain of the data warehouse. We are not storing metrics at a content item level, but at a base_path level (page level). This is due to the existence of some content items, like guides, that share the same content id for muliple pages.
Please, read the following ADRs to get additional information.
- Track collected metrics by base_path
- Track attribute changes by base_path
- Convention for unique warehoue identifier
Dates dimension
Contains date attributes that are used to add time context to metrics and
editions.
All metrics and editions needs time to be complete, because:
- Each metric has a foreign key to the day the meassure was collected.
- Each edition has a foreign key to the day the edition was created.
You can also observe that we have other attributes in the dimension (year, week, month...), these attributes are used to enable grouping and aggregations; This is a common practices in data warehouses.
Aggregations
g Aggregations are a common practice in data warehouses. There is no simpler way to speed up queries than aggregating data.
Usually aggregations are created from fact tables. In our case, we are creating monthly aggregations from facts metrics table.
Monthly aggregations
There are two tables involved in montly aggregations:
Monthly metrics: table monthly_metrics
Stores the sum of all aggregable metrics in a month. It also stores the
aggregation for the current month.
On a daily basis, the system will update the aggregations for the current month, creating a new entry at the beginning of each month.
Month dimension: table month_dimensions
Contains all the months to current day. It is updated automatically each month.
We reference each metric in the aggregations table to the month in which it was collected (via a foreign key to the monthly dimensions table).
Benefits
The improvement in performance is substantial. Let's see the difference in nunber of rows performing a simple calculation: Total number of unique pageviews in a year for HMRC:
- With no aggregation:
80,000 editions x 365 days = 29,200,000 rows
- With no aggregation:
80,000 editions x 12 days = 960,000 rows
Aggregations result in a 30x decrease in the number of rows needed to be queried. For example, if the query on the facts table takes 60 seconds, running the same query on the aggregated table would take around 2 seconds.
Drawbacks
We should not create aggregations just to improve a query. Aggregations add complexity to the data warehouse and can be a source for bugs. Before creating new aggregations we would need to think about:
- How frequently do we use the Aggregation.
- Who is the user of the information? Is longer query latency acceptable for queries that only run occasionally? runs the report occassionally?
- What is the impact on the database when running the query. Is it taking too many resources?