content-data-api: data-warehouse-what-and-why
Table of Contents
This document is not an in-depth explanation of what Data Warehouse is but an
explanation of the reasons behind building it. There are many online resources
and books about Data Warehouses if you want to get further information about
this matter.
To understand the foundation for the Data Warehouse, let's start with the long term vision that guided our work.
Long term vision
Give departments the data they need, at the point they need it so that they can
manage their GOV.UK content at scale over time.
Let's explore in detail:
Give departments the data they need
Departments manage content daily. They publish, update and archive content as part of their daily work; as of today, content designers have to search across multiple sources or tools to find metrics. Some of these sources are inaccessible, difficult to use or require further analysis. We aim to provide them with a single location to see all relevant metrics about their content. This information is beneficial to make informed decisions about their next steps.
As per user research, content designers would benefit from having two types of metrics.
- Metrics about content performance:
Metrics that define how content behaves when it interacts with GOV.UK users. For
example, the number of visits, the number of searches within the page, the
number of feedback comments that a page is receiving, or the overall
satisfaction with a particular page.
These metrics are tracked daily.
- Metrics about content quality:
These metrics are tracked/updated on each new version.
Metrics that define core characteristics of content: the reading score, use of
passive voice, guidelines compliance, number of paragraphs, words, complex sentences,...
At scale and over time
At scale and over time key principles for the Data Warehouse, because
content designers are interested in:
- Metrics for each content item that is or have been live in GOV.UK (around 550K)
- Trends of each of the metrics over time
To explain in detail why over time is important, let us explore three simple examples.
Example 1: Number of Content Items published by an organization
Departments are content owners; this means that they are responsible for publishing, updating and archiving/retiring their content daily. Diligent management of content implies a steady pace of updates and publications while keeping the total number of content items in a sensible number.
For example, if an organization is publishing at a very high rate for an extended period of time, it could be a signal that they need to improve the way they archive or retire existing content.
To get these insights about content publication we can't focus on metrics for a single day, we need to understand how those metrics evolved over time.
Let's explore the example:
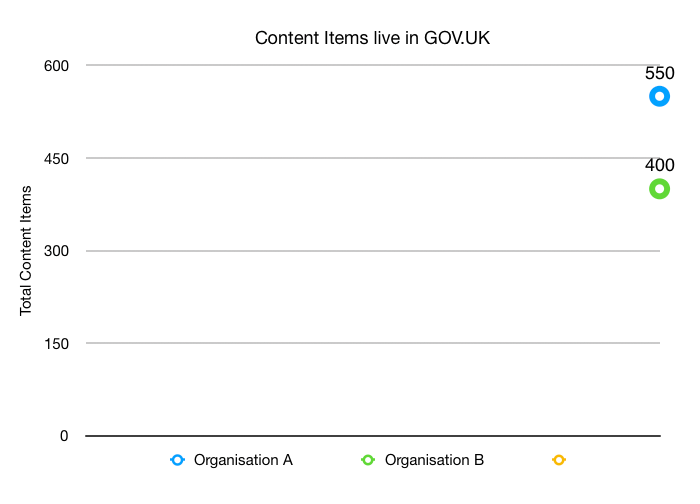
- Content Items published by an organization in one day
We have two organizations: A and B. In the last day, Organisation A has
550 live Content Items and Organisation B has 400.
With this information, it is hard to see if those organizations are effectively managing their content because we only have a data points for a single day.
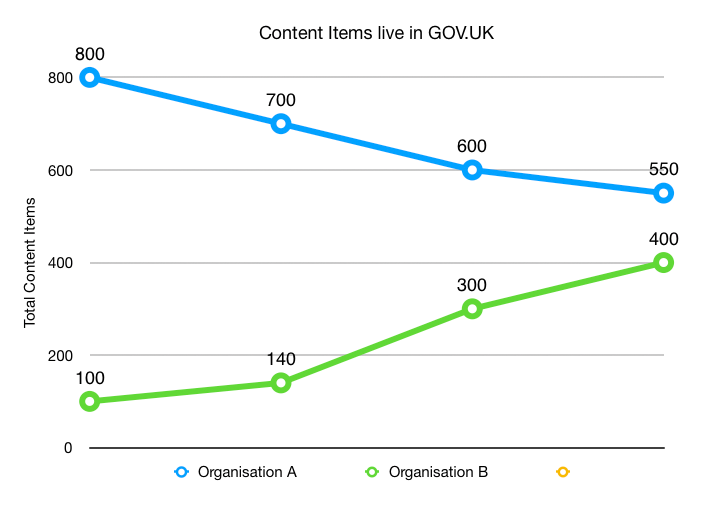
- Content Items published by an organization over time*
If we track the number of content items over time, then we might observe
that Organisation A is decreasing the number of Content Items daily, and
Organisation B has created too many content items in the last year.
We can conclude that organization b would need to take action to improve the
way they manage content over time: they can make an informed decision based on
data about the way they manage content.
Example 2: Enforcing good practices
Data is not only to help departments to manage their content over time; it can also help to provide evidence about compliance to best practices and guidelines.
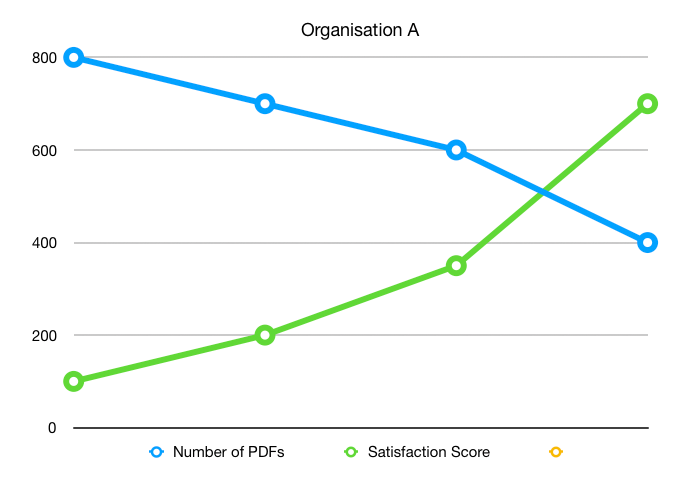
For example, we discourage departments from publishing content in PDF format. There are many reasons for it, but having some metrics to prove that PDFs are not benefitial for users, would make it easier for departments to fully comply with GOV.UK guidelines.
In the following example, we can see how there is a relationship between the
number of PDFs published by Organisation A and the satisfaction score.
Example 3: Predictions
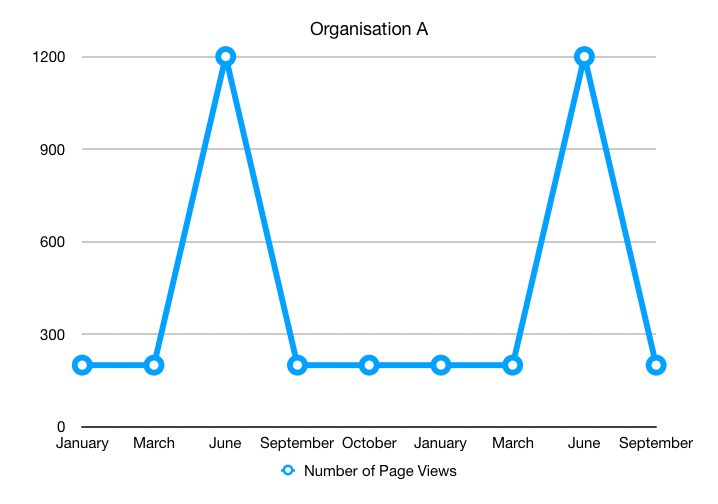
User interactions with content on GOV.UK can sometimes follow seasonal patterns. If on a particular week or month of the year a set of pages receive a spike on the number of visits, it is possible those pages will receive a similar number of visits the following year during the same period.
Let's explore the following example:
As per the spike of visits in June last year, it is very likely that
Organisation A expects a spike in page views for a content item, so they might
consider reviewing in advance the content, so it is accurate and up to date.
Why a Data Warehouse
Considerations for building a new application
Before building a new application, we explored if the existing set of applications and data sources were good enough to fulfill our mission goals.
This is what we found out:
-
We don't have a single place to retrieve all metrics for content items. We currently store metrics for organizations (and dashboards) via the performance platform, but the way it is structured and the scope of the product, make it not a good fit for our mission goal.
-
We store the number of page views in Search, so when users search in GOV.UK the results are ordered by popularity; the way this information is collected has been reported as Tech debt and building this applpcation will enable Search to use the API and pay the tech debt.
-
Data Scientists find it difficult to get and link content and performance metrics. Having a single place to look for this information will make their daily work easier.
-
Performance Analysts dashboards will also benefit from having metrics from multiple sources because, although they have direct access to metrics from Google Analytics, they don't have direct access to Feedex or other internal applications.
We concluded that we had to find custom way to store metrics and content attributes through time, because the existing applications were more focused on metrics and content characteristics for a single day.
Tracking metrics through time in a Data Warehouse
Now that we have a better understanding of the needs behind tracking metrics at scale and through time, and need for the existing application, let's explore why we have chosen a Data Warehouse as the underlying technology to support this functionality.
Considering the user needs and the long term vision we need:
A way to track daily snapshots of performance metrics, from multiple sources, of
all our content over time, so we can analyze it to make informed decisions about
content.
If we look into the Wikipedia definition of a Data Warehouse:
A central repository of integrated data from one or more disparate sources, that
stores current and historical data in one single place that is used for creating
analytical reports for workers throughout the enterprise.
And, if we replace:
| source | replaced |
|---|---|
| one or more disparate sources | Feedex, Google Analytics |
| workers | content designers |
| the enterprise | All GOV.UK organizations |
We get:
A central repository of integrated data from Feedex, Google Analytics, PAAS...,
that stores current and historical data in one single place that is used for
creating analytical reports for content designers throughout all GOV.UK
organizations.
So, it seems that from a definition / formal perspective, it fits in what we need to track metrics through time.
Track content changes over time for Content Items
We not only need to track metrics about how content is performing through time, but we also need to monitor the content attributes, so we understand the relationship between content and performance changes through time.
Say, for example, that a content item was created and published three years ago. To get a good understanding of how the content changes are related to their performance, we would need to:
- Track each change to the Content Item through the three years
- Update the quality metrics each time a new version is created
- Link the performance metrics to each one of the versions of the Content Item.
Tracking the history of each content item is key to understand the relationship between content and performance.